 Main Menu Toggle
University of North
Texas Educator Preparation Program
CREATE Report of Employment Statistics
Outcome Measures: Ability of Completers to be hired in Education Positions
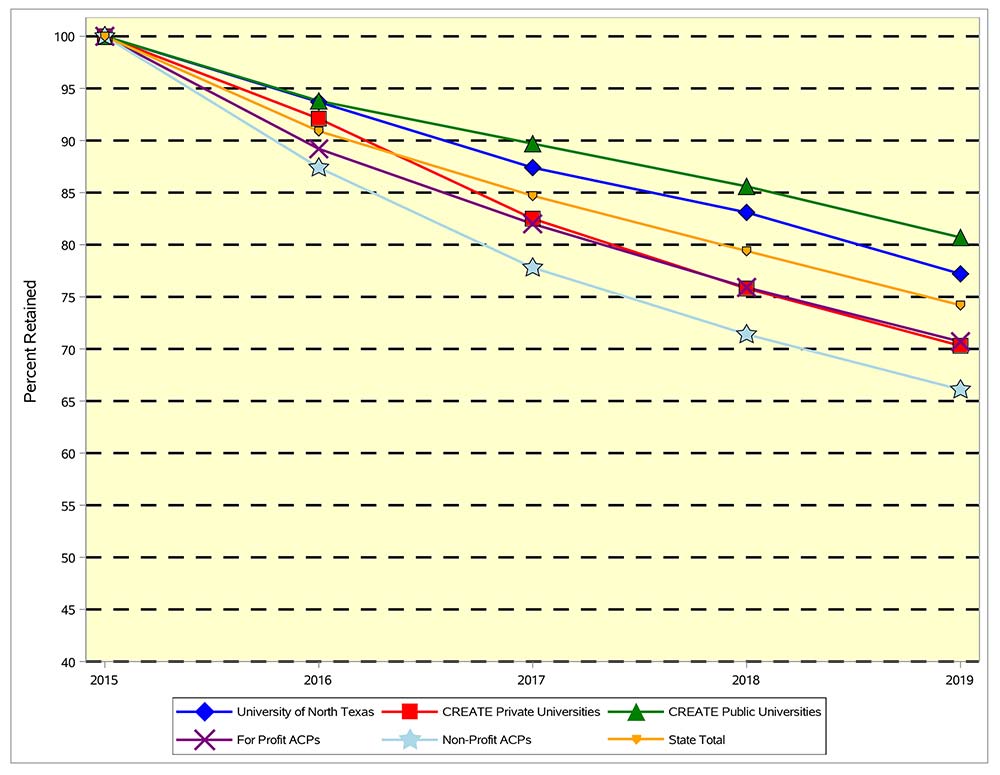
Comparison of Teacher Retention Trends Five-Year Retention of First-Year Teachers1,2
2015 - 2019
|
Entity/ Organization |
Number Teachers3 |
2015 |
Percent Retained in Spring of Academic Year 2016 2017 2018 |
2019 |
Attrition Rate |
||
|---|---|---|---|---|---|---|---|
|
University of North Texas |
478 |
100.0 |
93.7 |
87.4 |
83.1 |
77.2 |
22.8 |
|
CREATE Public Universities |
7216 |
100.0 |
93.8 |
89.7 |
85.6 |
80.7 |
19.3 |
|
CREATE Private Universities |
901 |
100.0 |
92.1 |
82.5 |
75.8 |
70.3 |
29.7 |
|
For Profit ACPs |
8180 |
100.0 |
89.2 |
82.0 |
75.9 |
70.7 |
29.3 |
|
Non-Profit ACPs |
2523 |
100.0 |
87.4 |
77.8 |
71.4 |
66.1 |
33.9 |
|
State Total |
21254 |
100.0 |
90.9 |
84.7 |
79.4 |
74.2 |
25.8 |
1Includes teachers obtaining a standard or probationary certificate in 2013-2014, becoming employed in 2014-2015 with no prior teaching experience.
2Texas data only tracks public school employment.
3Numbers less than 10 are not represented on this figure.
PACE 2019
Source Data Teacher Certification and Assignment Files, TEA
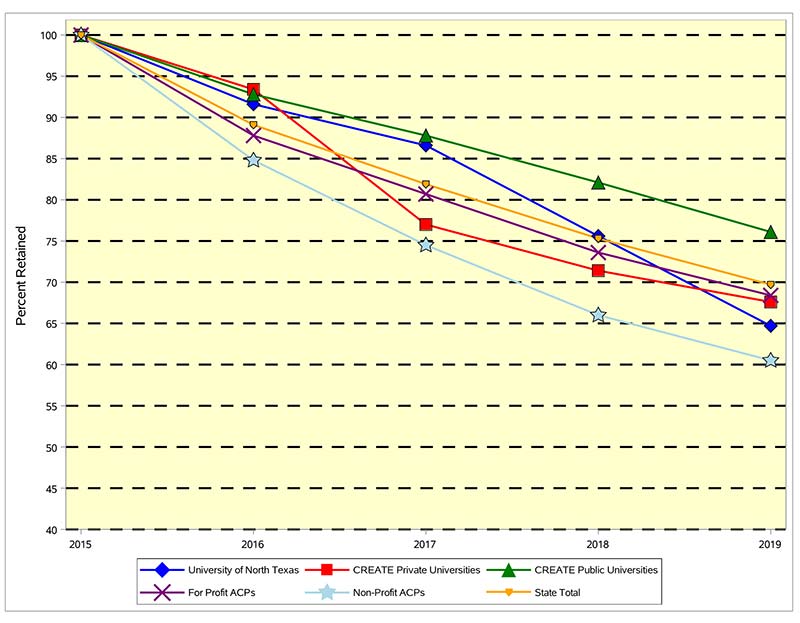
Comparison of Teacher Retention Trends
Five-Year Retention of First-Year Teachers by School Level1,2
2015 - 2019
High School
University of North Texas
|
Entity/ Organization |
Number Teachers3 |
2015 |
Percent Retained in Spring of Academic Year 2016 2017 2018 |
2019 |
Attrition Rate |
||
|---|---|---|---|---|---|---|---|
|
University of North Texas |
119 |
100.0 |
91.6 |
86.6 |
75.6 |
64.7 |
35.3 |
|
CREATE Public Universities |
1371 |
100.0 |
92.8 |
87.8 |
82.1 |
76.1 |
23.9 |
|
CREATE Private Universities |
213 |
100.0 |
93.4 |
77.0 |
71.4 |
67.6 |
32.4 |
|
For Profit ACPs |
2610 |
100.0 |
87.8 |
80.7 |
73.6 |
68.4 |
31.6 |
|
Non-Profit ACPs |
620 |
100.0 |
84.8 |
74.5 |
66.0 |
60.5 |
39.5 |
|
State Total |
5250 |
100.0 |
89.1 |
81.9 |
75.3 |
69.7 |
30.3 |
1Includes teachers obtaining a standard or probationary certificate in 2013-2014, becoming employed in 2014-2015 with no prior teaching experience.
2Texas data only tracks public school employment.
3Numbers less than 10 are not represented on this figure.
PACE 2019
Source Data Teacher Certification and Assignment Files, TEA
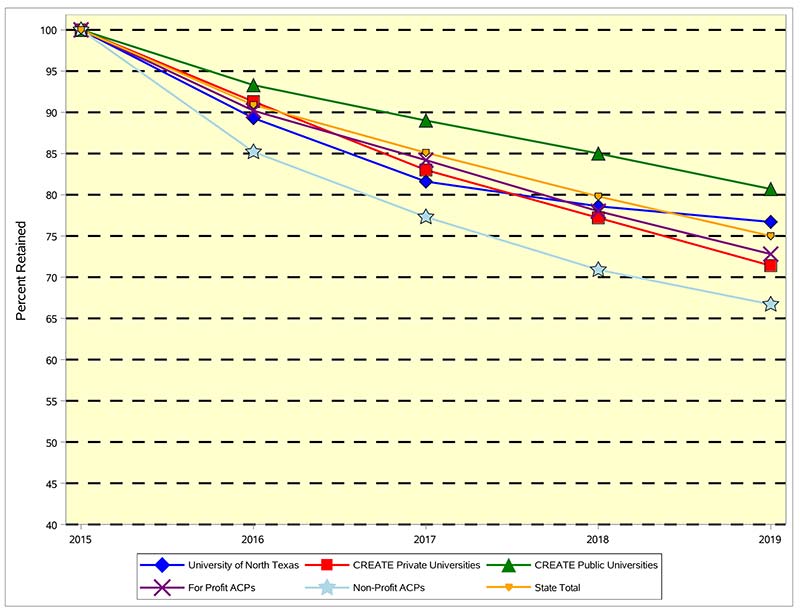
Comparison of Teacher Retention Trends
Five-Year Retention of First-Year Teachers by School Level1,2
2015 - 2019
Middle School
University of North Texas
|
Entity/ Organization |
Number Teachers3 |
2015 |
Percent Retained in Spring of Academic Year 2016 2017 2018 |
2019 |
Attrition Rate |
||
|---|---|---|---|---|---|---|---|
|
University of North Texas |
103 |
100.0 |
89.3 |
81.6 |
78.6 |
76.7 |
23.3 |
|
CREATE Public Universities |
1522 |
100.0 |
93.3 |
89.0 |
85.0 |
80.7 |
19.3 |
|
CREATE Private Universities |
206 |
100.0 |
91.3 |
83.0 |
77.2 |
71.4 |
28.6 |
|
For Profit ACPs |
2419 |
100.0 |
90.2 |
84.2 |
78.0 |
72.8 |
27.2 |
|
Non-Profit ACPs |
642 |
100.0 |
85.2 |
77.3 |
70.9 |
66.7 |
33.3 |
|
State Total |
5444 |
100.0 |
90.9 |
85.1 |
79.8 |
75.0 |
25.0 |
1Includes teachers obtaining a standard or probationary certificate in 2013-2014, becoming employed in 2014-2015 with no prior teaching experience.
2Texas data only tracks public school employment.
3Numbers less than 10 are not represented on this figure.
PACE 2019
Source Data Teacher Certification and Assignment Files, TEA
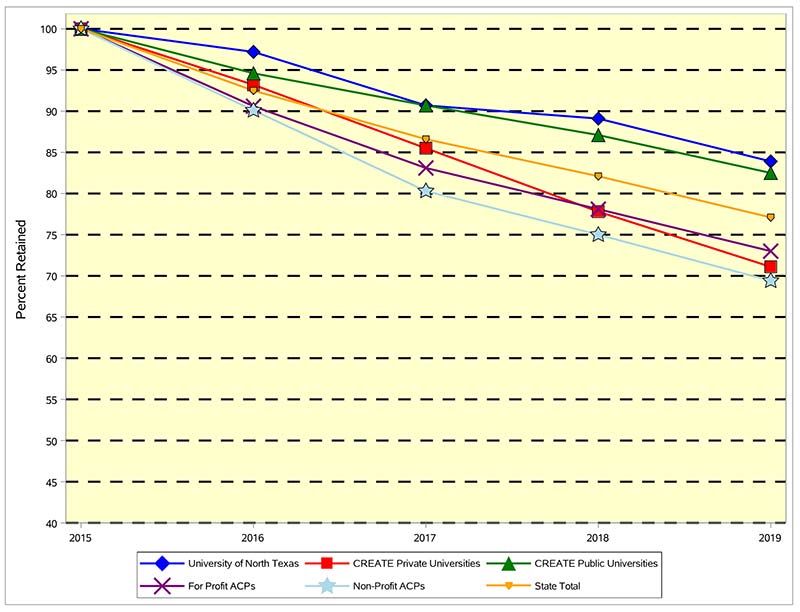
Comparison of Teacher Retention
Trends Five-Year Retention of First-Year Teachers by School Level1,2
2015 - 2019
Elementary School
|
Entity/ Organization |
Number Teachers3 |
2015 |
Percent Retained in Spring of Academic Year 2016 2017 2018 |
2019 |
Attrition Rate |
||
|---|---|---|---|---|---|---|---|
|
University of North Texas |
248 |
100.0 |
97.2 |
90.7 |
89.1 |
83.9 |
16.1 |
|
CREATE Public Universities |
4114 |
100.0 |
94.6 |
90.7 |
87.1 |
82.5 |
17.5 |
|
CREATE Private Universities |
454 |
100.0 |
93.2 |
85.5 |
77.8 |
71.1 |
28.9 |
|
For Profit ACPs |
2701 |
100.0 |
90.6 |
83.1 |
78.1 |
73.0 |
27.0 |
|
Non-Profit ACPs |
1156 |
100.0 |
90.1 |
80.3 |
75.0 |
69.4 |
30.6 |
|
State Total |
9672 |
100.0 |
92.5 |
86.6 |
82.1 |
77.1 |
22.9 |
1Includes teachers obtaining a standard or probationary certificate in 2013-2014, becoming employed in 2014-2015 with no prior teaching experience.
2Texas data only tracks public school employment.
3Numbers less than 10 are not represented on this figure.
PACE 2019
Source Data Teacher Certification and Assignment Files, TEA